
We work with the industry-leading AI stack


This model identifies hydrothermal alteration zones associated with minerals such as sericite, muscovite, kaolinite, alunite, and quartz—typical of porphyry or epithermal environments. These minerals are frequently linked to the presence of gold, copper, and silver, making this model a key indicator for defining priority mineral exploration areas.

This model detects the concentration of clay minerals such as kaolinite, illite, and smectite, which serve as markers for argillic alteration. Their presence is associated with hydrothermal processes and mineral accumulations of economic interest, providing valuable data for geological mapping, mineral prospecting, and land-use planning.

This model reveals areas with high concentrations of iron oxides, such as hematite, goethite, and limonite, which are indicative of surface oxidation and hydrothermal alteration. These zones are often related to the secondary mineralization of iron, copper, and gold, making this a fundamental model for identifying favorable structures and for environmental monitoring.

This model identifies zones with potential for lithium-bearing pegmatites, applying spectral ratios that highlight the presence of spodumene, lepidolite, and petalite—minerals associated with lithium, tantalum, and tin. This approach enables the mapping of favorable areas within granitic and hydrothermal systems, contributing to early-stage prospecting and the prioritization of targets in energy exploration.

This model detects zones with potential for uranium mineralization by identifying hydrothermal alterations and spectral signatures associated with uraninite, autunite, and torbernite. These assemblages frequently occur alongside iron and copper in granitic or fracture-controlled systems with intense hydrothermal activity. The model allows for the delineation of favorable areas for uranium and associated metal prospecting, integrating spectral, structural, and geological criteria.

This model enables the detection and monitoring of acid effluents from active or abandoned mines by combining spectral analysis with AI-driven classification. It identifies areas affected by the oxidation of metallic sulfides—primarily pyrite and pyrrhotite—alongside the presence of dissolved iron and sulfates. This TerraX model is essential for environmental assessment, temporal tracking of contaminated waters, and the sustainable management of mining liabilities.

This model utilizes unsupervised neural networks to integrate and analyze multiple geospatial data sources, such as satellite imagery, geophysical, and geochemical data. This approach enables the identification of hidden patterns, anomalous zones, and mineral assemblages that are not evident through conventional analysis. Furthermore, it generates smart exploration maps, facilitating the detection of potential mineralized zones and optimizing field campaign planning.

This model enables the supervision of active mining areas and environmental liabilities through multi-temporal satellite imagery and AI analysis. It detects the expansion of extraction fronts, changes in waste rock piles, and variations in tailings and acid drainage, providing key information for environmental management, operational traceability, and sustainable mining planning.

This model enables the detection and analysis of ground movements with millimetric precision through Satellite Radar Interferometry (InSAR) techniques. The model integrates data to monitor subsidence, landslides, mining deformations, and structural stability. Its application is essential for geotechnical risk management, environmental oversight, and infrastructure planning in sensitive areas.

Success Story - San Juan, Argentina
Success Story: San Juan, Argentina
In San Juan, we deployed the TerraX® Geospatial Analyzer across an area spanning tens of thousands of hectares.
The multi-spectral analysis enabled us to:
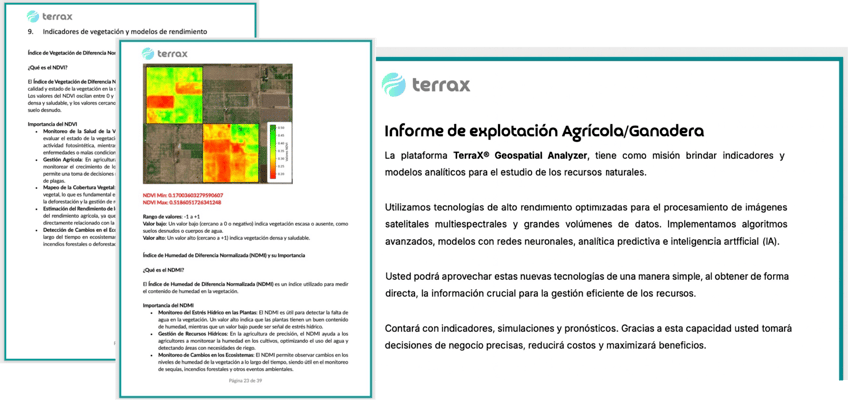

Normalized Difference Vegetation Index
This index is a measure of healthy, green vegetation. The combination of its normalized difference formulation and the use of the highest chlorophyll absorption and reflectance regions makes it robust across a wide range of conditions.

Leaf Area Index
This index is used to estimate foliage cover and to predict crop growth and yield.

Green Chlorophyll Index
This index is used to estimate leaf chlorophyll content across a wide variety of plant species.

Soil Brightness Index
This index acts as an indicator of organic matter, sand content, and salinity. It enables the analysis of soil degradation and erosion—key factors for agricultural sustainability.

Normalized Difference Moisture Index
This index is used to determine vegetation water content and is ideal for detecting water stress in plants. Healthy vegetation exhibits high NDMI values, while low values indicate that plants are under stress due to a lack of moisture.

Normalized Difference Water Index
This index is used to differentiate water bodies from dry land areas and to map surface water features. On maps, it is typically represented in shades of blue.

Water Band Index
This index is used to quantify relative water content at the leaf level.

Moisture Stress Index
This index is used to analyze canopy water stress, predict productivity, and perform biophysical modeling. High index values indicate greater water stress in plants and lower moisture content in both soil and foliage.

AI Model for Crop Yield Inference
This AI-based model is designed to estimate and infer crop yields using multi-source data. It enables the generation of accurate, scalable predictions at the field level and identifies high- and low-productivity zones to optimize management decisions, contributing to a more efficient and sustainable management of the analyzed territory.

AI Model for Potential Crop Inference
An artificial intelligence model trained on multi-spectral satellite imagery and agronomic reference data to identify and classify potential crops within a study area. It utilizes supervised learning algorithms to distinguish spectral patterns associated with different crops and generate probability or distribution maps. This model enables the assessment of agricultural suitability, rotation planning, and soil-use optimization based on specific field conditions.

Climate Data Module
A climate analysis module that integrates key meteorological variables—temperature, precipitation, solar radiation, wind, and dew point—to characterize the environmental behavior of a region over time. It enables the assessment of seasonality, the detection of anomalies, and the correlation of atmospheric conditions with crop development or soil productivity.

Soil Data Module
A module that integrates fundamental edaphic variables—bulk density, organic matter, pH, cation exchange capacity (CEC), texture (clay, silt, and sand), and nitrogen content—to characterize soil structure and fertility. These indicators enable the assessment of productive capacity, water and nutrient retention, and land suitability for various crops. The model facilitates agronomic decision-making focused on sustainability and optimized soil management at the field level.

Aerosol Optical Depth
The model measures the concentration of atmospheric aerosols and their effect on solar radiation. This variable indicates how much solar light is absorbed or scattered by suspended particles, enabling the assessment of pollution levels and the atmosphere’s energy balance.

NO₂ – Nitrogen Dioxide
The model quantifies the presence of nitrogen dioxide, a pollutant derived from vehicular and industrial combustion. Its values allow for the estimation of urban and industrial pollution levels and their influence on the formation of tropospheric ozone.

CH₄ – Methane
The model evaluates concentrations of this greenhouse gas, which has a global warming potential more than 25 times higher than that of CO₂. It enables the identification of both natural and anthropogenic emission sources, contributing to the calculation of the global carbon footprint.

CO – Carbon Monoxide
The model detects incomplete combustion emissions in urban and industrial sectors. Although its direct climate impact is lower, it plays a key role in ozone formation and atmospheric chemistry.
This model enables the supervision of active mining areas and environmental liabilities through multi-temporal satellite imagery and AI analysis. It detects the expansion of extraction fronts, changes in waste rock piles, and variations in tailings and acid drainage, providing key information for environmental management, operational traceability, and sustainable mining planning.
This model enables the detection and monitoring of acid effluents from active or abandoned mines by combining spectral analysis with AI-driven classification. It identifies areas affected by the oxidation of metallic sulfides—primarily pyrite and pyrrhotite—alongside the presence of dissolved iron and sulfates. This TerraX model is essential for environmental assessment, temporal tracking of contaminated waters, and the sustainable management of mining liabilities.

